ESIQ
Low Carbon & New Energies
InsightMay 202622 min readESIQ Research

Marine Shipping Decarbonisation

Navigating the transition to low-carbon shipping - the regulations, fuels, infrastructure and freight economics reshaping a $14-trillion trade engine, and the intelligence that turns carbon risk into competitive advantage.
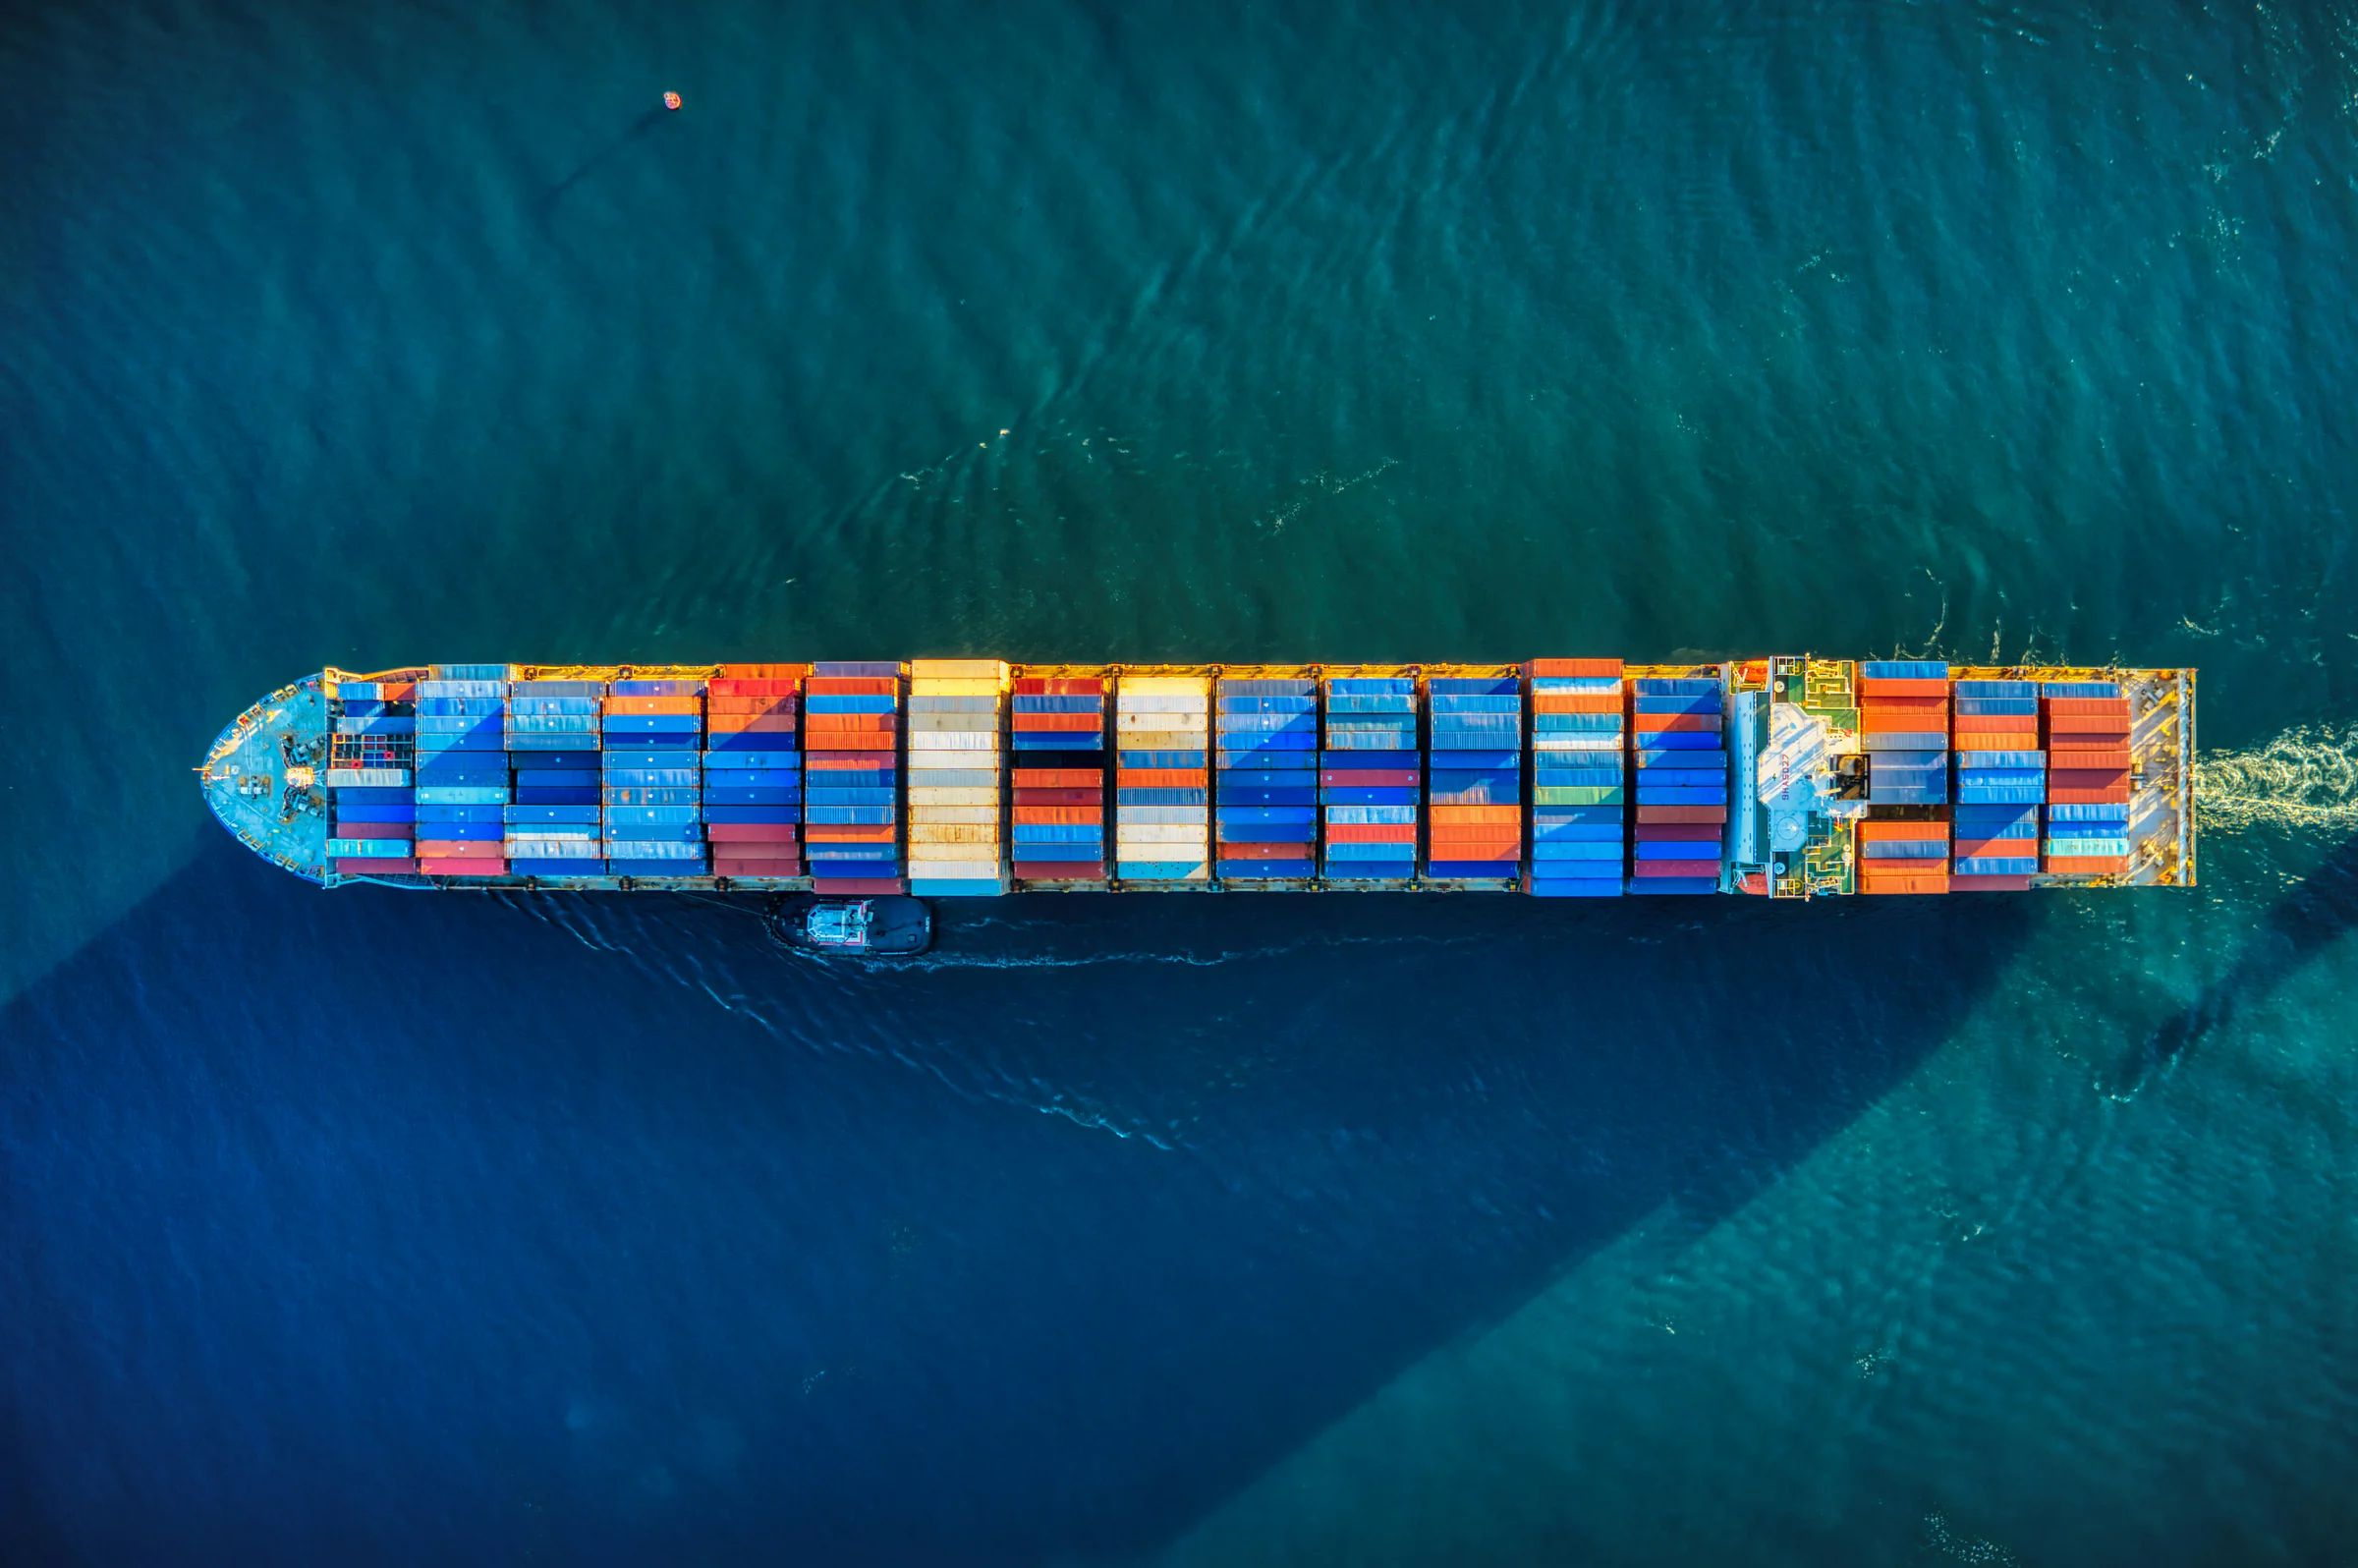
Container ship at sea - marine shipping decarbonisation intelligence

Shipping moves the world - on the dirtiest fuel left in the energy system.The sector carries around 11 billion tonnes of goods a year across 100,000+ vessels, and emits roughly 3% of global CO₂. For decades that ran on heavy fuel oil. The IMO's 2050 net-zero target has now made that impossible to sustain.

Carbon pricing, fuel-intensity standards and charterer ESG pressure are converging at once - and a whole new fuel ecosystem (LNG, methanol, ammonia, hydrogen, biofuels) is emerging in its place. The owners who read the transition correctly will lock in green premiums, infrastructure access and ESG capital; those who don't face stranded assets.

~3%
of global CO₂ emissions from international shipping
~11 Bn
tonnes of goods transported by sea annually
100k+
commercial vessels in operation globally
01Why it matters now

Why shipping decarbonisation matters now

Six forces are compressing the window for action - and they are now arriving simultaneously, creating a transition inflection unlike anything the maritime sector has previously faced.

Net-zero targets
IMO's 2050 net-zero ambition creates binding fleet-wide emissions ceilings. Non-compliant vessels face stranding risk.
Fuel transition
HSFO-dependent fleets face existential cost risk as LNG, methanol and ammonia reshape the bunker market.
Carbon pricing risk
Emerging maritime carbon levies will add $50-150/t CO₂, fundamentally reshaping voyage economics.
Freight cost impact
Green-fuel premiums of 1.5-3× VLSFO will restructure trade routes and cargo economics globally.
Charterer pressure
Major cargo owners enforce green-shipping KPIs and FuelEU Maritime compliance across their supply chains.
First-mover advantage
Early adopters lock in green-premium contracts, low-carbon infrastructure access and ESG capital.
02IMO regulations & carbon pricing

The rules redrawing the bunker market

Two decades of IMO regulation have moved from sulphur limits to a binding net-zero trajectory. EEDI sets design efficiency, CII rates vessels A-E annually, and SEEMP mandates onboard management - together they make carbon a balance-sheet item.

The IMO decarbonisation roadmap

2005MARPOL Annex VI - first air-pollution limits on shipping
2020IMO sulfur cap 0.5% - VLSFO era begins, HSFO phase-out accelerates
2023Revised GHG strategy - net-zero by ~2050 formally adopted
2026CII / EEDI Phase 3 tightening; FuelEU Maritime enters force
2030−40% carbon intensity target vs. 2008 baseline
2040−70% carbon intensity target; IMO carbon levy expected in force
2050Net-zero GHG ambition - full decarbonisation of maritime transport

The Carbon Intensity Indicator (CII) - A to E, rated annually

A
Major improvement
B
Minor improvement
C
Moderate
D
Below target
E
Correction required
D (3 years) or E (1 year)
Triggers a mandatory corrective-action plan in SEEMP - and charterers may reject D/E vessels outright from their approved lists.
Slow steaming economics
Cutting speed 10% reduces fuel use ~27% - the single biggest operational lever for CII compliance, at near-zero capex.

Future carbon pricing & fuel standards

FuelEU Maritime
EU regulation mandating GHG-intensity reduction. Penalties up to €2,400/t VLSFO-equivalent for non-compliance.
IMO carbon levy
A global carbon-price mechanism. Revenues fund green-shipping R&D and developing-nation transition support.
Well-to-wake accounting
Full lifecycle emissions (extraction → combustion) are now included in carbon-pricing calculations.
RFNBO preference
Renewable Fuels of Non-Biological Origin receive preferential carbon-accounting treatment under FuelEU.
03Alternative marine fuels

From heavy fuel oil to a multi-fuel future

No single fuel will replace heavy fuel oil. The market is fracturing into a multi-fuel ecosystem - with different fuels dominating different vessel types, trade routes, and decarbonisation timelines.

Bunker market share by fuel & era

HSFO
85% · pre-2020
VLSFO
55% · 2020-25
LNG
15% · 2025-30
Biofuels (blend)
10% · now-2035
Methanol
8% · 2028-35
Ammonia
5% · 2030-40
Hydrogen
2% · 2035-50
LNG - pragmatic today
✓ 20-25% CO₂ & ~90% SOx reduction vs HSFO
✓ CII improvement of 1-2 grades; IMO-compliant now
⚠ Methane slip, +15-25% capex, limited bunkering routes
~530+ LNG-fuelled vessels on order (2025E)
Ammonia - zero-carbon horizon
✓ Zero carbon at combustion; 200Mt+/yr already produced
✓ Leverages existing LPG terminal infrastructure
⚠ Toxicity, NOx aftertreatment, +25-40% vessel capex
HD Hyundai engines targeting commercial 2026-28

Methanol - the green-transition pathway

Grey
From natural gas (SMR). Low cost, high carbon (~2.5t CO₂/t).
Blue
Grey + CCS. Transitional, $350-450/t.
Bio-methanol
From biomass/MSW. ~60-80% CO₂ reduction.
e-Methanol
Green H₂ + CO₂. Near-zero. $800-1,200/t, target <$500 by 2035.
Case study · Maersk green-methanol fleet

Maersk has ordered 25 methanol-capable vessels (18,000+ TEU) for delivery 2024-2027, with the pioneer vessel launched in 2023 - green methanol sourced across Europe, the Americas and Asia. The fleet commitment represents the single largest green-shipping investment in the container sector.

25
vessels ordered
$14B+
fleet investment
2050
net-zero goal
Biofuels - drop-in decarbonisation
B30 blends (30% bio + 70% VLSFO) are near drop-in and used today by CMA CGM, Maersk and MSC for Scope 3 reporting. ISCC/RSB-certified biofuels count as zero-carbon under FuelEU. B100 bio-HSFO runs $1,200-1,800/t; feedstock supply is the primary constraint.
Hydrogen & synthetic e-fuels
Green hydrogen (storage at −253°C) is pilot-stage; e-methanol is early-commercial; e-ammonia is in pilots; synthetic LNG remains R&D. RFNBOs receive the most favourable FuelEU treatment - creating strong regulatory pull from 2030 onwards.
04Bunkering infrastructure & port readiness

Fuel is only as available as the port

A vessel can only burn what it can bunker. LNG has a 5-7 year infrastructure head start; methanol is building; ammonia is barely begun. Hub readiness now shapes route economics and fleet deployment decisions.

Alternative-fuel readiness by major bunkering hub

HubVLSFOLNGMethanolAmmoniaReadiness
SingaporePilot-High
RotterdamPilotHigh
AntwerpPilotHigh
Fujairah--Medium
HoustonLtd--Low-Med
LNG · ~220 terminals
Largest existing network - 220+ terminals and 80+ bunker vessels by 2025E. A 5-7 year head start over methanol and ammonia.
Methanol · 35% ready
Liquid at ambient temp, chemical-tanker compatible. Rotterdam & Antwerp operational. Capex $15-30M per port facility.
Ammonia · 12% ready
Needs −33°C storage, toxic-gas handling and port redesign. Pilots only in 2025. Capex $40-80M per port facility.
05Freight & voyage economics

Carbon moves into the freight rate

The economics of moving cargo are being repriced. Green fuel premiums, carbon levies and CII compliance costs are embedding themselves into voyage economics - and the gap between early adopters and laggards is widening.

+18-55%
freight premium, green vs VLSFO baseline
$50-150
per-tonne CO₂ levy added to voyage cost
2-4%
annual fuel-cost rise from CII compliance tightening
1.5-3×
green methanol/ammonia cost vs VLSFO per energy unit

Marine fuel economics & well-to-wake emissions

Fuel$/t (2025)$/GJgCO₂/MJCII benefit
HSFO410-45010.591.7None
VLSFO500-55012.889.0Moderate
LNG (spot)550-70013.575.2Good
Bio-LNG900-1,10022.018.0Excellent
Grey methanol400-48017.068.0Moderate
Green methanol800-1,20034.52.5Excellent
Green ammonia700-1,00028.06.0Excellent

Energy-adjusted cost ($/GJ) and well-to-wake intensity. Indicative spot prices, 2025.

Sector outlook to 2035

SectorOutlookKey driver
ContainerPositiveGreen surcharges mainstream by 2027; fleet renewal drives capacity discipline.
Dry bulkNeutralCoal decline offset by biomass/grain; decarbonisation adds ~8-12% to rates.
Clean tankerStableBiofuel/methanol movements offset product-trade changes; LR2 modernisation ongoing.
Dirty tankerChallengingHSFO demand in structural decline; older Aframax/Suezmax face stranding risk.

Under ESIQ's base case, green methanol and ammonia reach carbon-adjusted cost parity with fossil fuels by ~2030-2033. Early movers lock in supply at pre-parity prices.

06How ESIQ supports marine decarbonisation strategies

Research built for maritime transition decisions

ESIQ provides bespoke intelligence, market mapping, and voice-of-customer research for organisations navigating the marine decarbonisation transition - whether as fleet owners, cargo operators, fuel producers, port developers, or investors.

01

Fuel Transition Intelligence

Tracking which alternative marine fuels are gaining commercial traction - by route, vessel type, and fleet owner - and where the green fuel supply chain is building fastest.

02

Regulatory & Policy Monitoring

Monitoring IMO GHG strategy implementation, FuelEU Maritime, EU ETS inclusion, CII/EEDI requirements and national maritime carbon frameworks.

03

Bunkering Infrastructure Mapping

Assessing green-fuel availability and port readiness by hub - identifying route viability, infrastructure gaps and first-mover positions.

04

Competitive Fleet Analysis

Profiling fleet decarbonisation strategies for major carriers, tanker owners and bulker operators - dual-fuel ordering patterns, scrubber retrofits and green contracts.

05

Voice of Customer Research

Understanding what charterers, cargo owners and freight buyers require from green shipping - and where the green premium ceiling lies across trade routes and cargo types.

06

Strategic Advisory & Market Entry

Supporting investment decisions, technology positioning and go-to-market planning for organisations entering or expanding across the maritime decarbonisation value chain.

Need clarity on a marine transition challenge?

Start a conversation with ESIQ about your research needs - from fuel transition intelligence to port readiness mapping and competitive fleet analysis.

Related Insights

Continue the research